About Us
We help cities see the full picture.
At Civic Q, we turn complex civic data into clear, actionable insights. Our work connects data to the financial realities that shape long-term prosperity revealing the trade-offs behind land use, infrastructure, housing, and policy decisions, and guiding cities toward strategies that build stronger tax bases and healthier long-term growth.
We work with cities, municipal agencies, and community coalitions. Whether the question is about a TIF district, a neighborhood plan, or a 20-year budget outlook, we bring the right tools and perspective to make the data speak clearly.

Carlos A. Michelen Strofer
Analyst & Business Manager
Carlos has 15 years of experience in software development, data analysis, and visualization. He holds a PhD in Aerospace Engineering from Virginia Tech and bachelor's and master's degrees in Naval Architecture and Marine Engineering from the University of Michigan. His work bridges technical rigor with practical decision-making for complex systems from the energy grid to how cities function.

Tyler S. Jordan
Analyst & Project Manager
Tyler's family history in New Mexico spans more than 150 years, and that deep connection drives his passion for making it a better place. He has 10 years of experience in systems-level programming, system architecture, and signal analysis, with a master's degree from Stanford University and a bachelor's from UNM in electrical engineering. His work spans data visualization, statistical analysis, and AI.
Services
1. Visualizing Fiscal Reality
A common mistake cities make is to equate raw revenue with the financial benefit of a development but that only tells half the story. We help cities see which land generates more than it costs, and which is effectively being subsidized.
- 3D revenue mapping (e.g. property tax per acre, gross receipts per acre)
- Cost-of-service and infrastructure ROI analysis
- Geographic solvency maps: where your city earns vs. where it spends
- Budget flow visualizations and long-term trend tracking
- Key performance indicators tailored to city priorities
See this in our portfolio: Albuquerque Value Density, Long-Term Financial Health, Budget Flow Visualization
2. Data-Driven Planning + Scenario Analysis
We translate complex datasets (budgets, parcels, demographics, infrastructure) into clear analysis and visual tools that reveal the trade-offs behind zoning, development, and investment decisions.
- Case studies to inform policy or project decisions
- Scenario modeling for zoning changes, development proposals, or infrastructure investments
- Mapping policy outcomes: equity, access, safety, and cost
See this in our portfolio: Budget Flow Visualization
3. Training + Custom Support
We empower cities and community leaders to ask better questions and use their own data more effectively.
- Training on GIS, data literacy, and budget analysis
- Workshops for elected officials, city staff, and community groups
- Custom tool development, database support, and reporting workflows
- Ongoing consulting to support internal data projects or decision processes

Our Portfolio
The work below is real analysis for a real city. Albuquerque, New Mexico, where we're based.
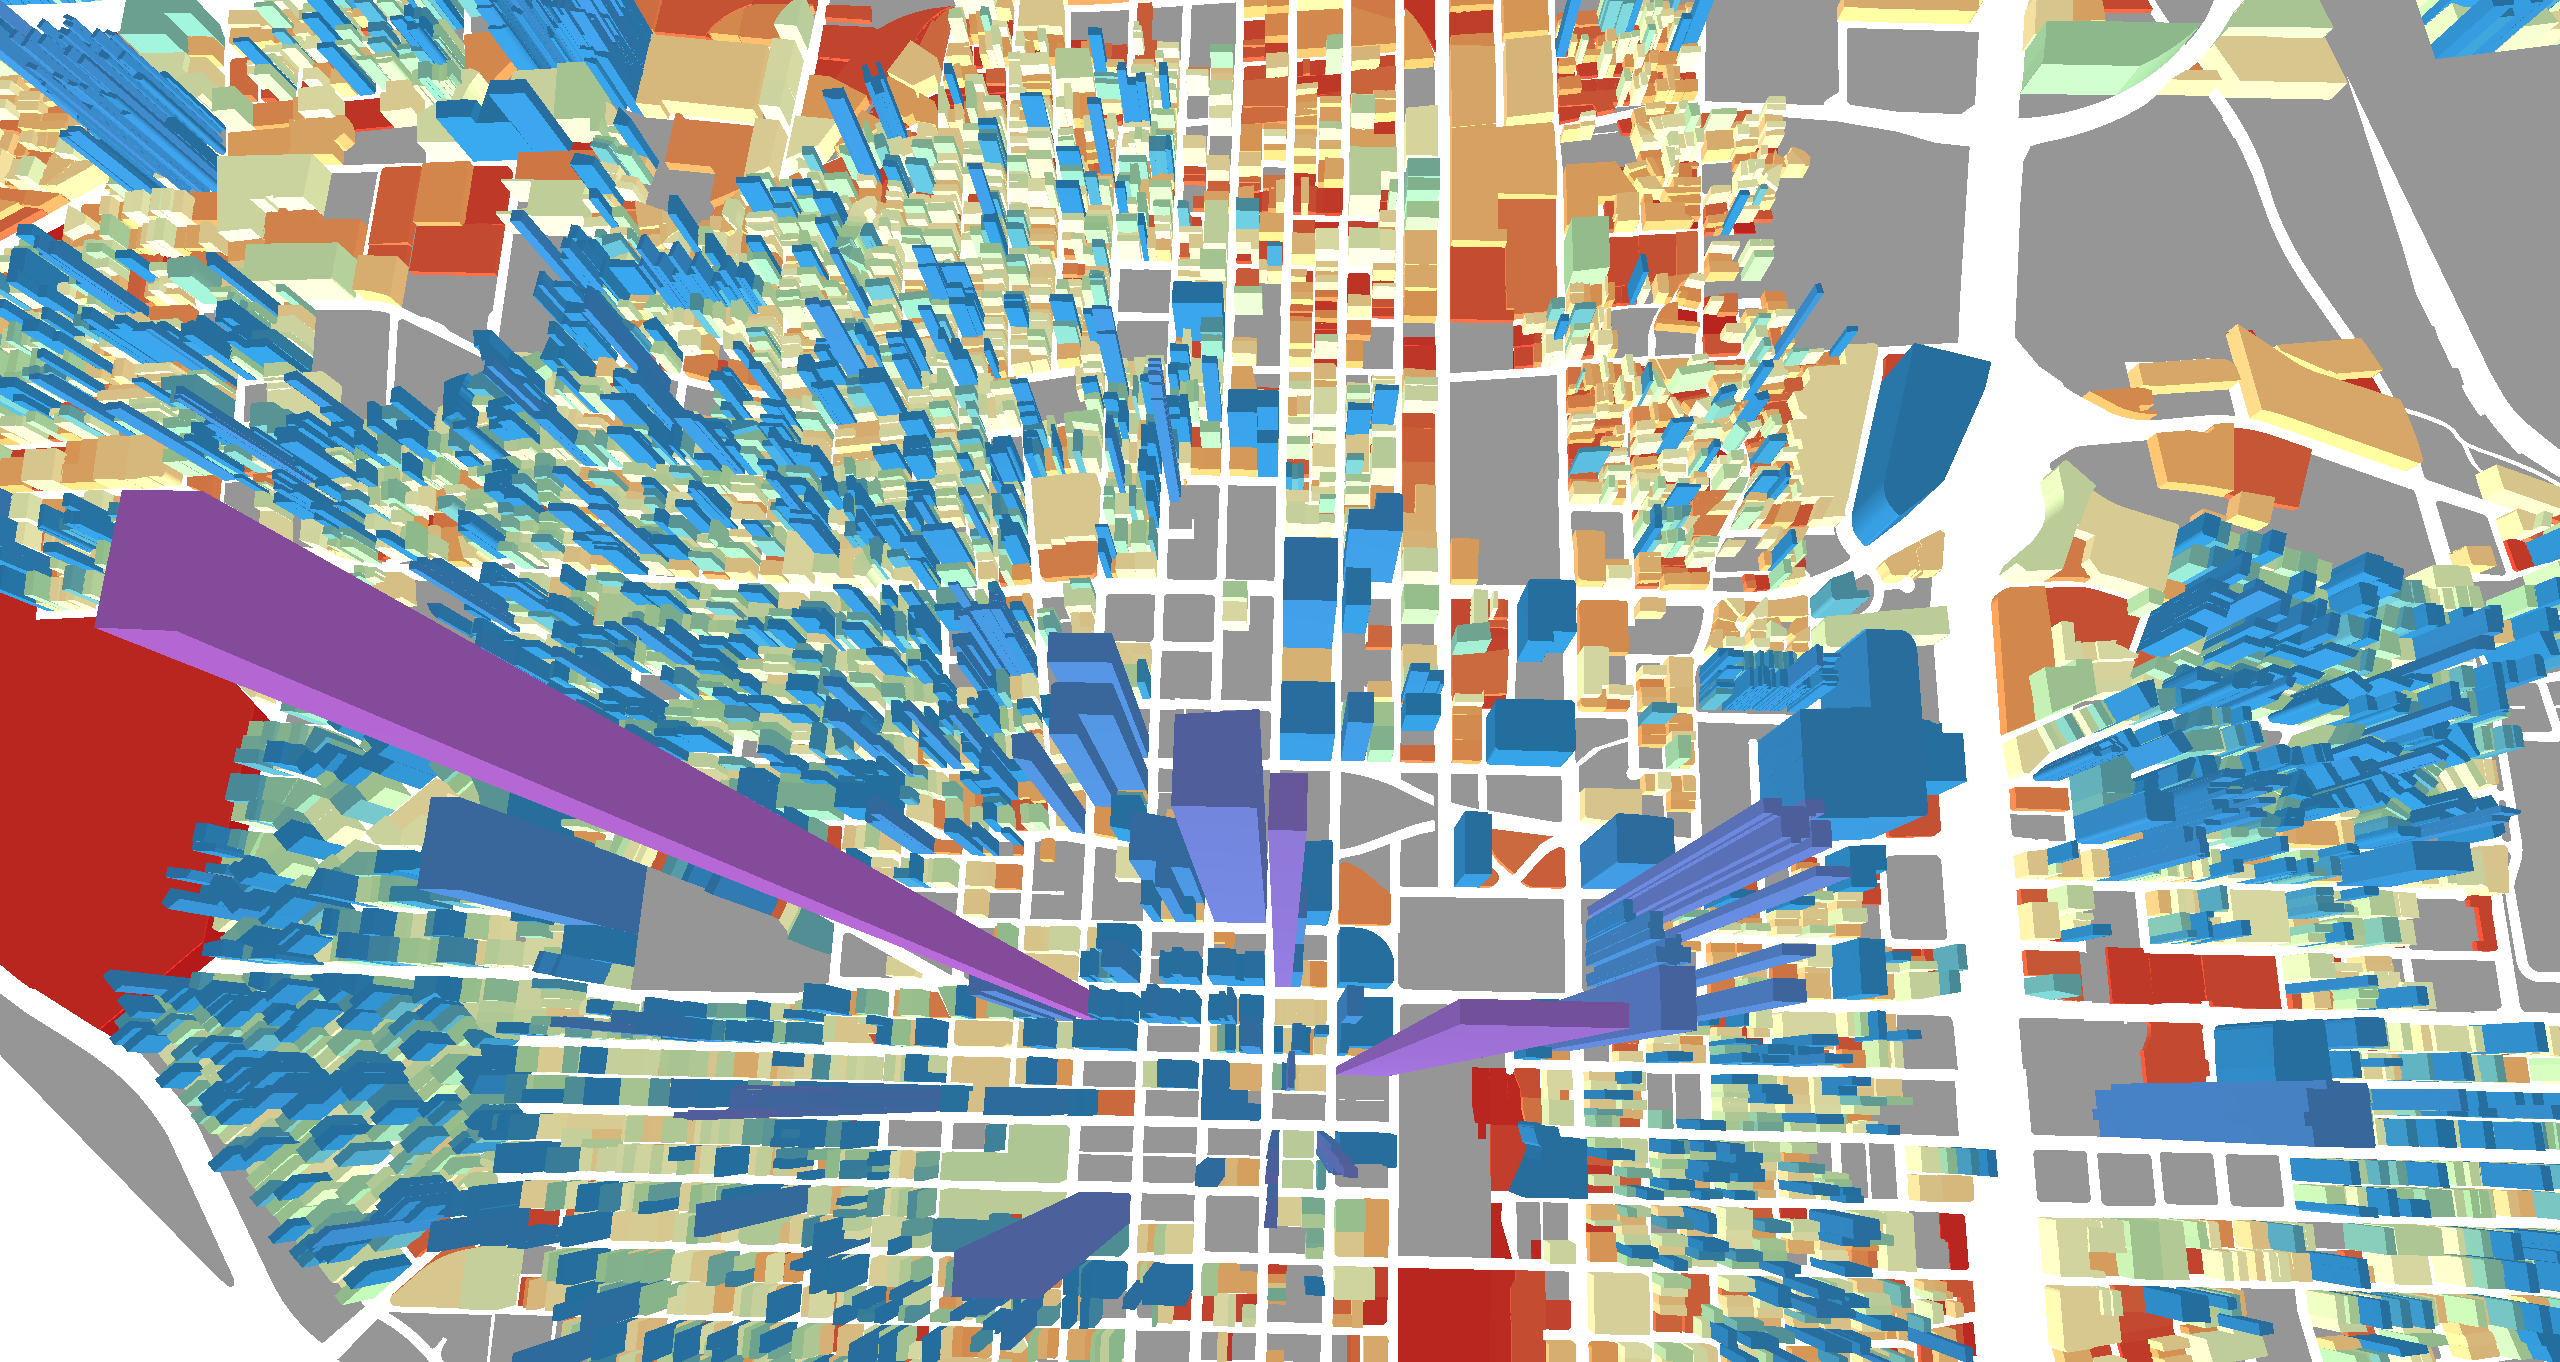
Albuquerque Value Density
A common mistake cities make is to equate raw revenue, such as property tax, with the overall financial benefit of a development. That only tells half the story. The more meaningful measure works like GDP per capita or miles per gallon: taxable value per acre is a well-established proxy for return on investment that reveals which developments generate more than they cost, and which the city is effectively subsidizing.
In this interactive 3D map, the height of each parcel represents its value density. Taller parcels are more financially productive. Full city coverage is available as part of a complete engagement. Open full-screen → | Watch our overview video →
Related service: Visualizing Fiscal Reality
Albuquerque Long-Term Financial Health
A year-to-year budget can balance on paper while still masking deeper problems. Just as a household might pay its bills each month but fall behind on saving for a new roof or car, a city can cover annual expenses while its long-term obligations quietly grow. Pavement, pipes, and public buildings all wear down over time, and debt payments can consume more and more of future budgets.
We compiled Albuquerque's financial statements over many years and applied standard measures of sustainability, flexibility, and vulnerability. The analysis shows the city's net financial position is roughly negative $1 billion, meaning it has more liabilities than assets. Infrastructure and long-term obligations are outpacing available resources, a trend that doesn't show up in any single year's budget.
Related service: Visualizing Fiscal Reality
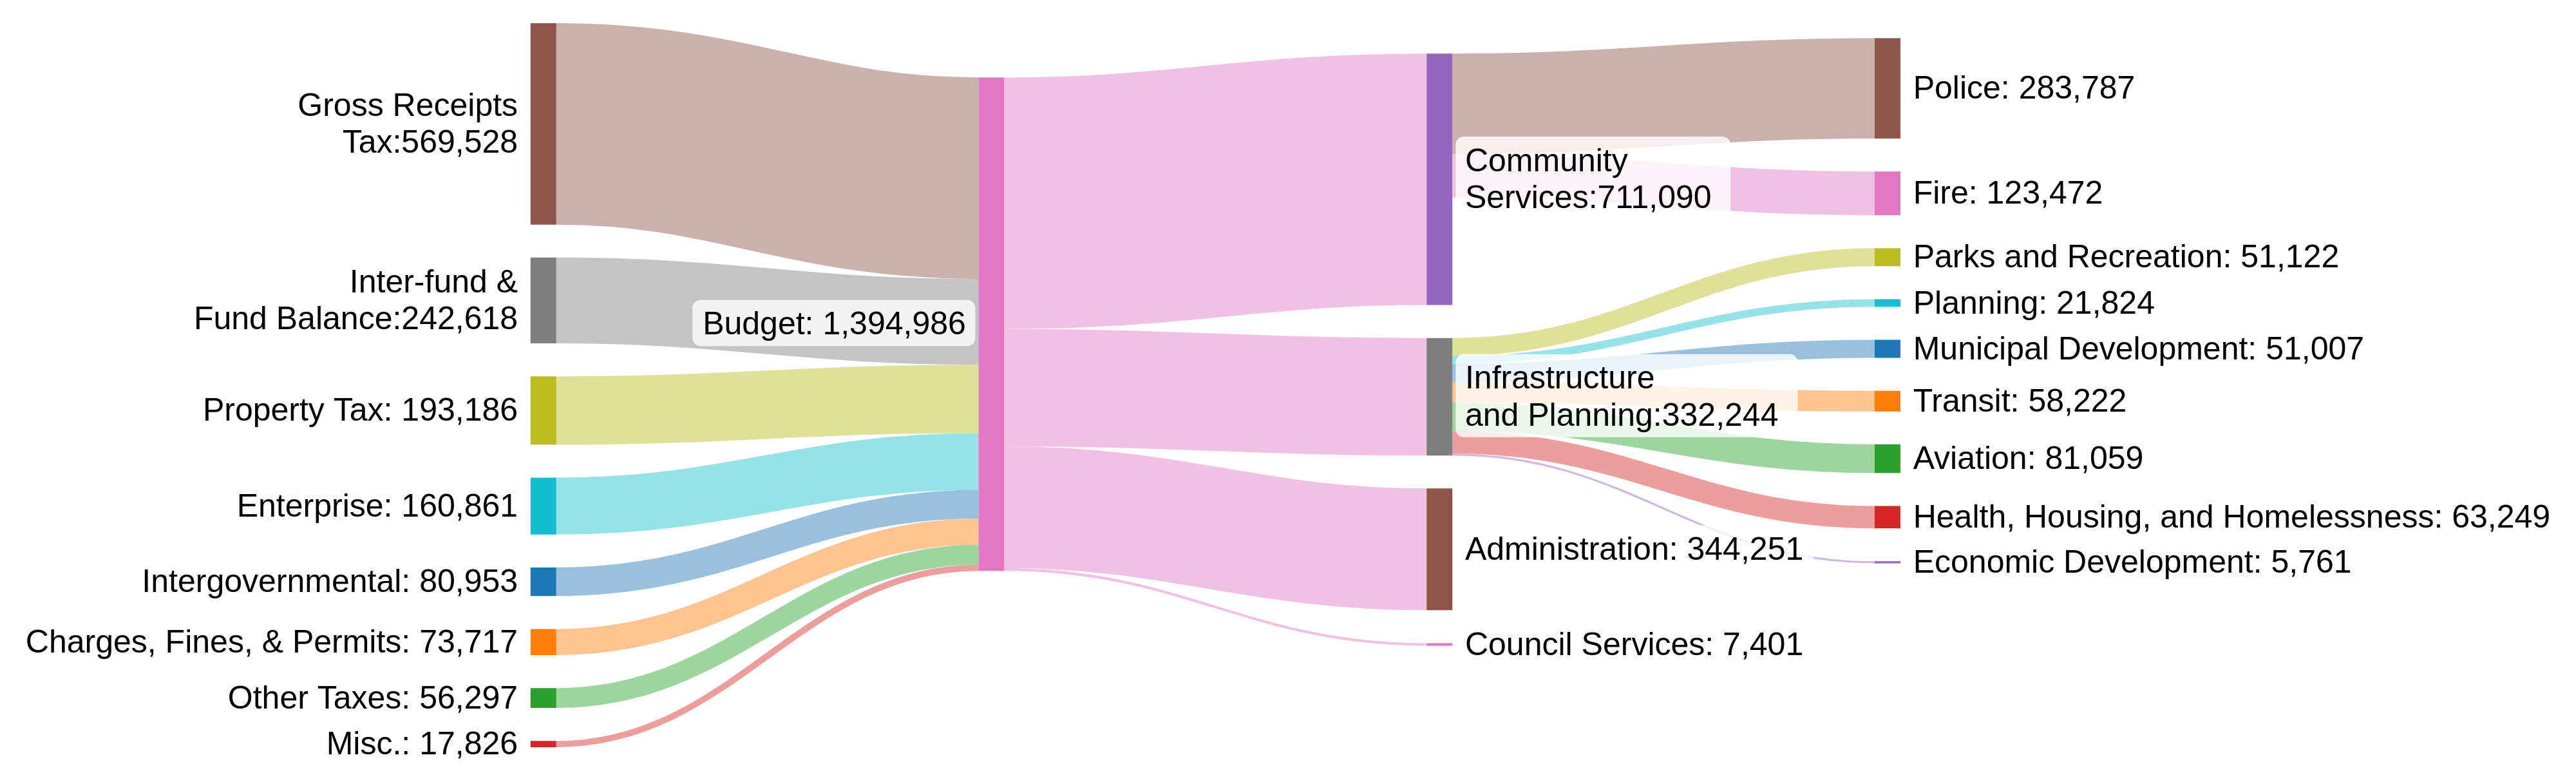
Budget Flow Visualization
The 2025 Albuquerque City Budget spans 238 pages of fund transfers, department budgets, and revenue sources. That volume makes it hard to see the full picture, and limits transparency into how public dollars flow through the system. How much goes to community services like police and fire? How does that compare to infrastructure? Where does the money come from?
We distilled it into a single graphic showing the flow of money from revenue sources, gross receipts tax, property tax, and enterprise funds, through city funds and into each department's budget. A proportional view that helps leaders and residents understand where the money goes.
Related services: Visualizing Fiscal Reality, Data-Driven Planning
Get in Touch
Every city is different, and we work from wherever you are. If one of our portfolio examples fits your needs, we can build it for your city with your data. If your question is something else entirely, we can scope it together.
Reach out to talk through what you're working on. No formal RFP needed to start a conversation.